
All your networks in one chart
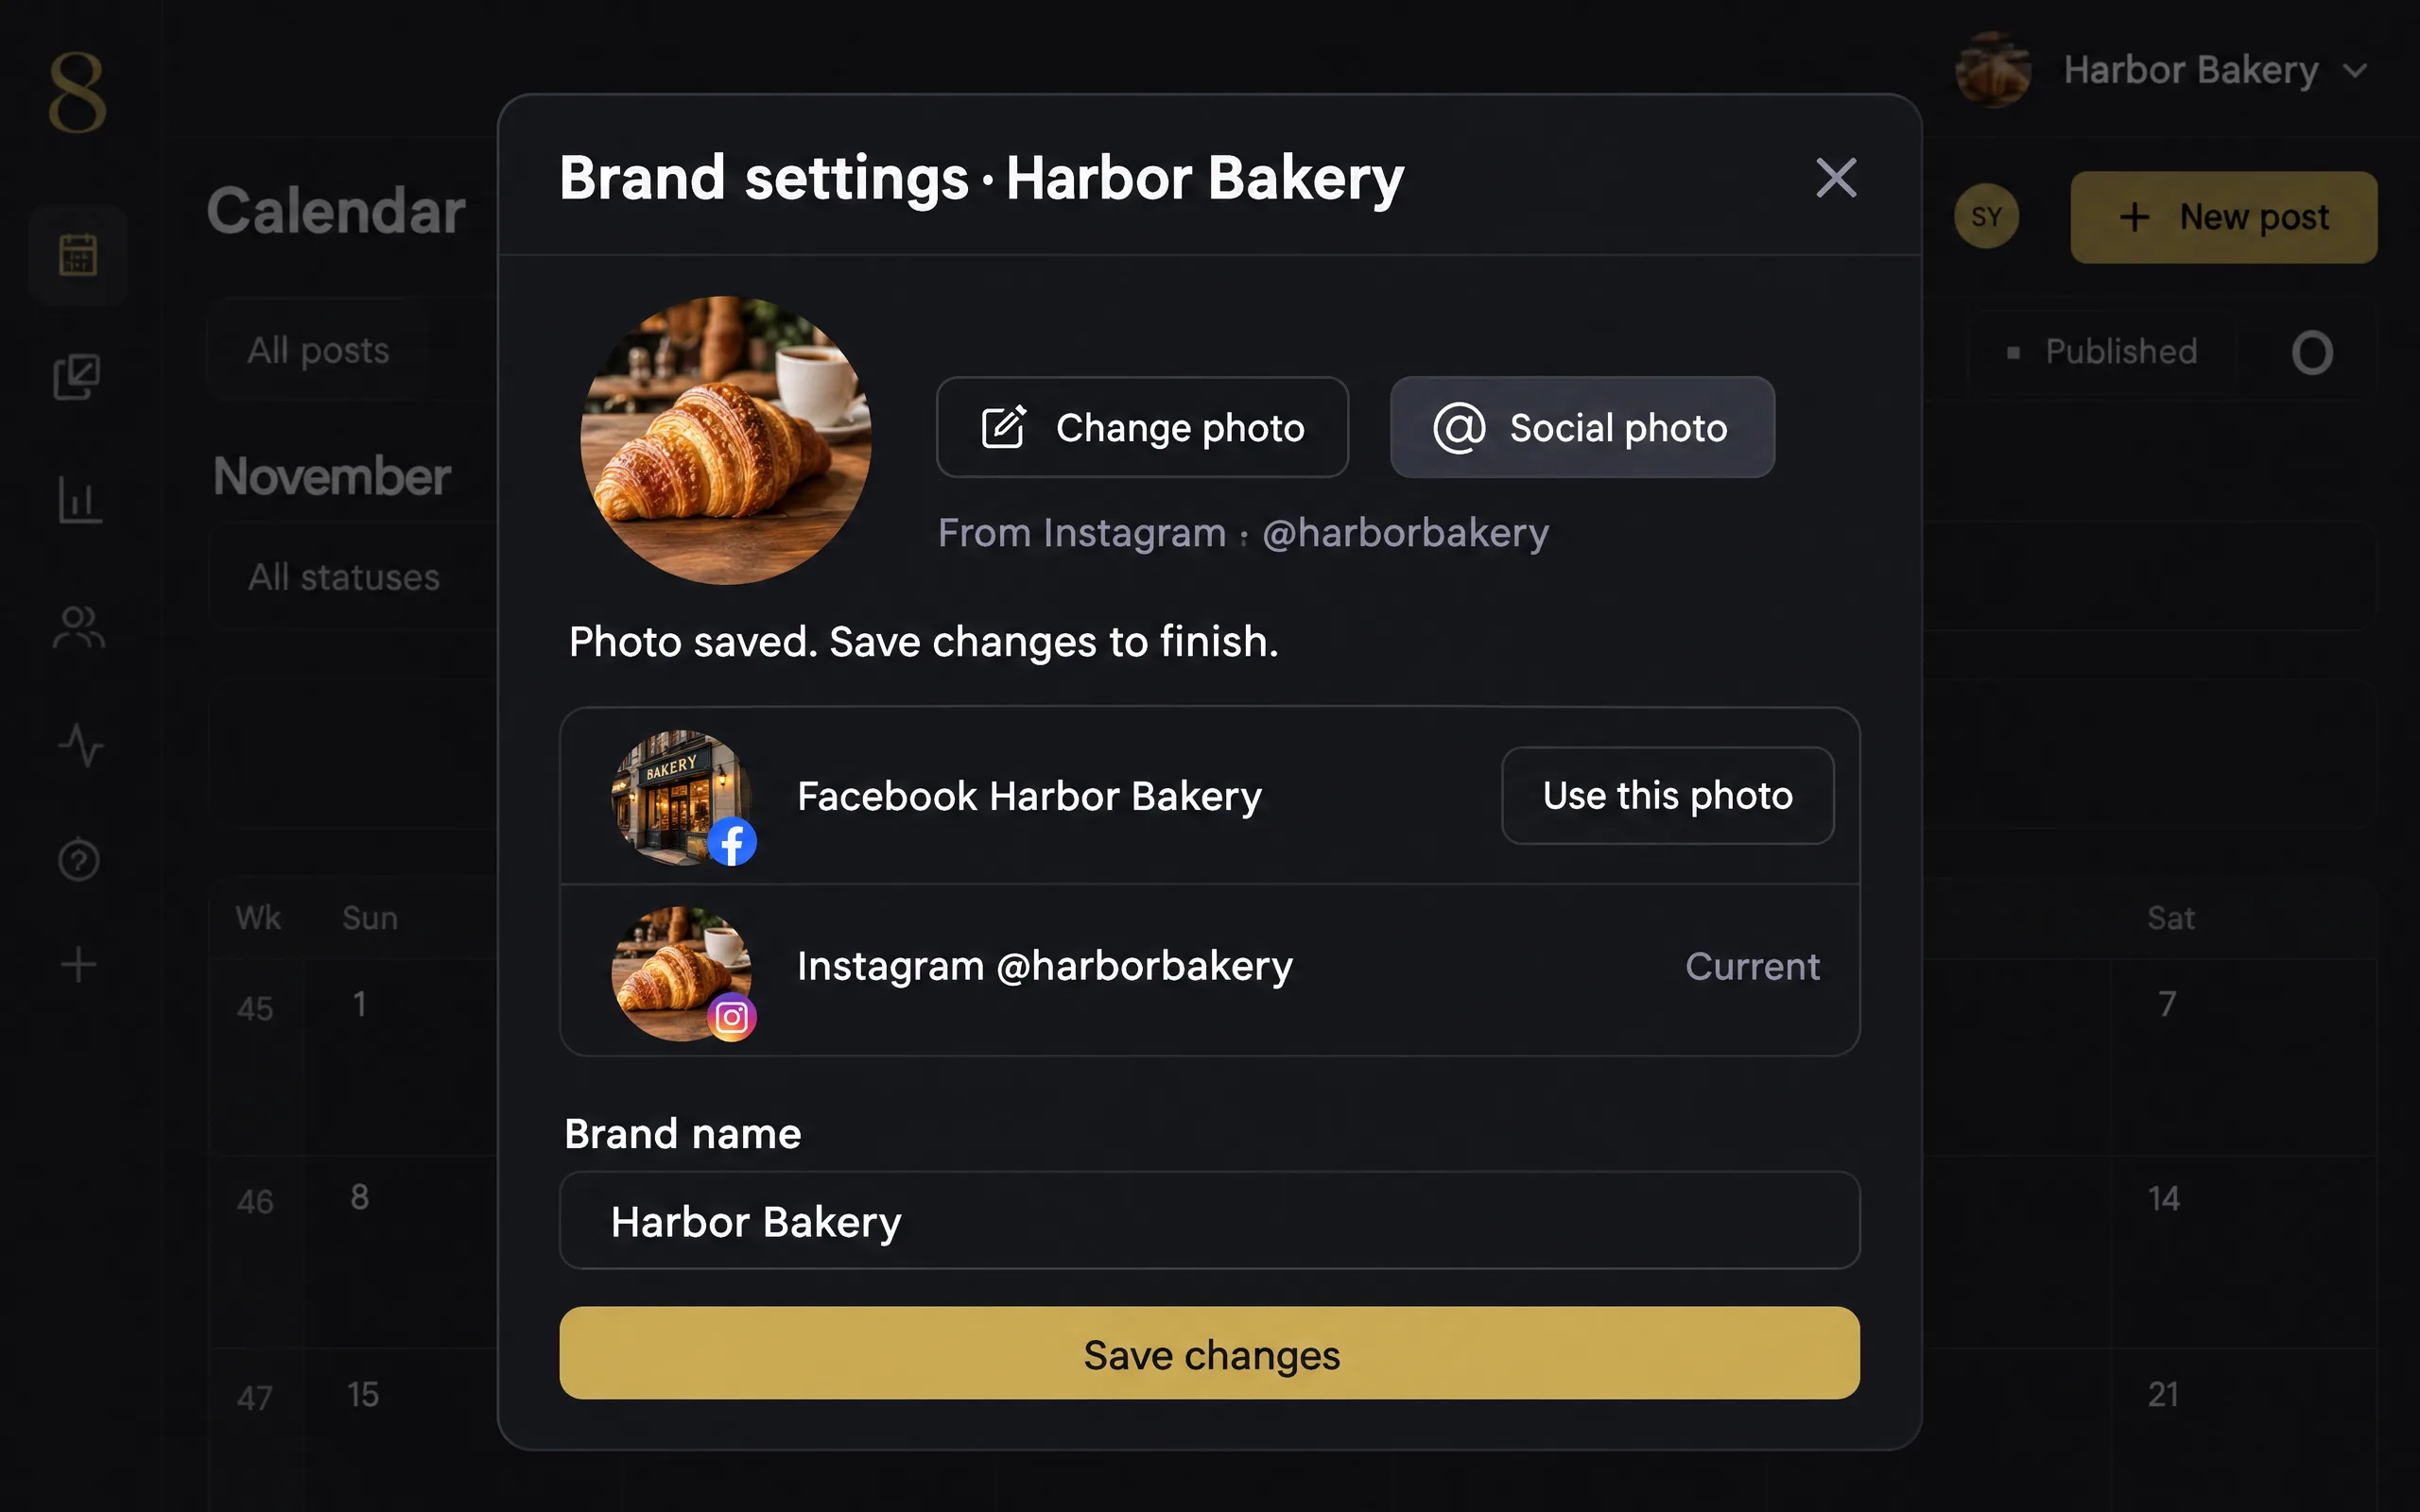
Performance now opens with every network’s followers in one chart, with dates, numbers and each network’s color. And a brand can take its photo from one of its accounts.
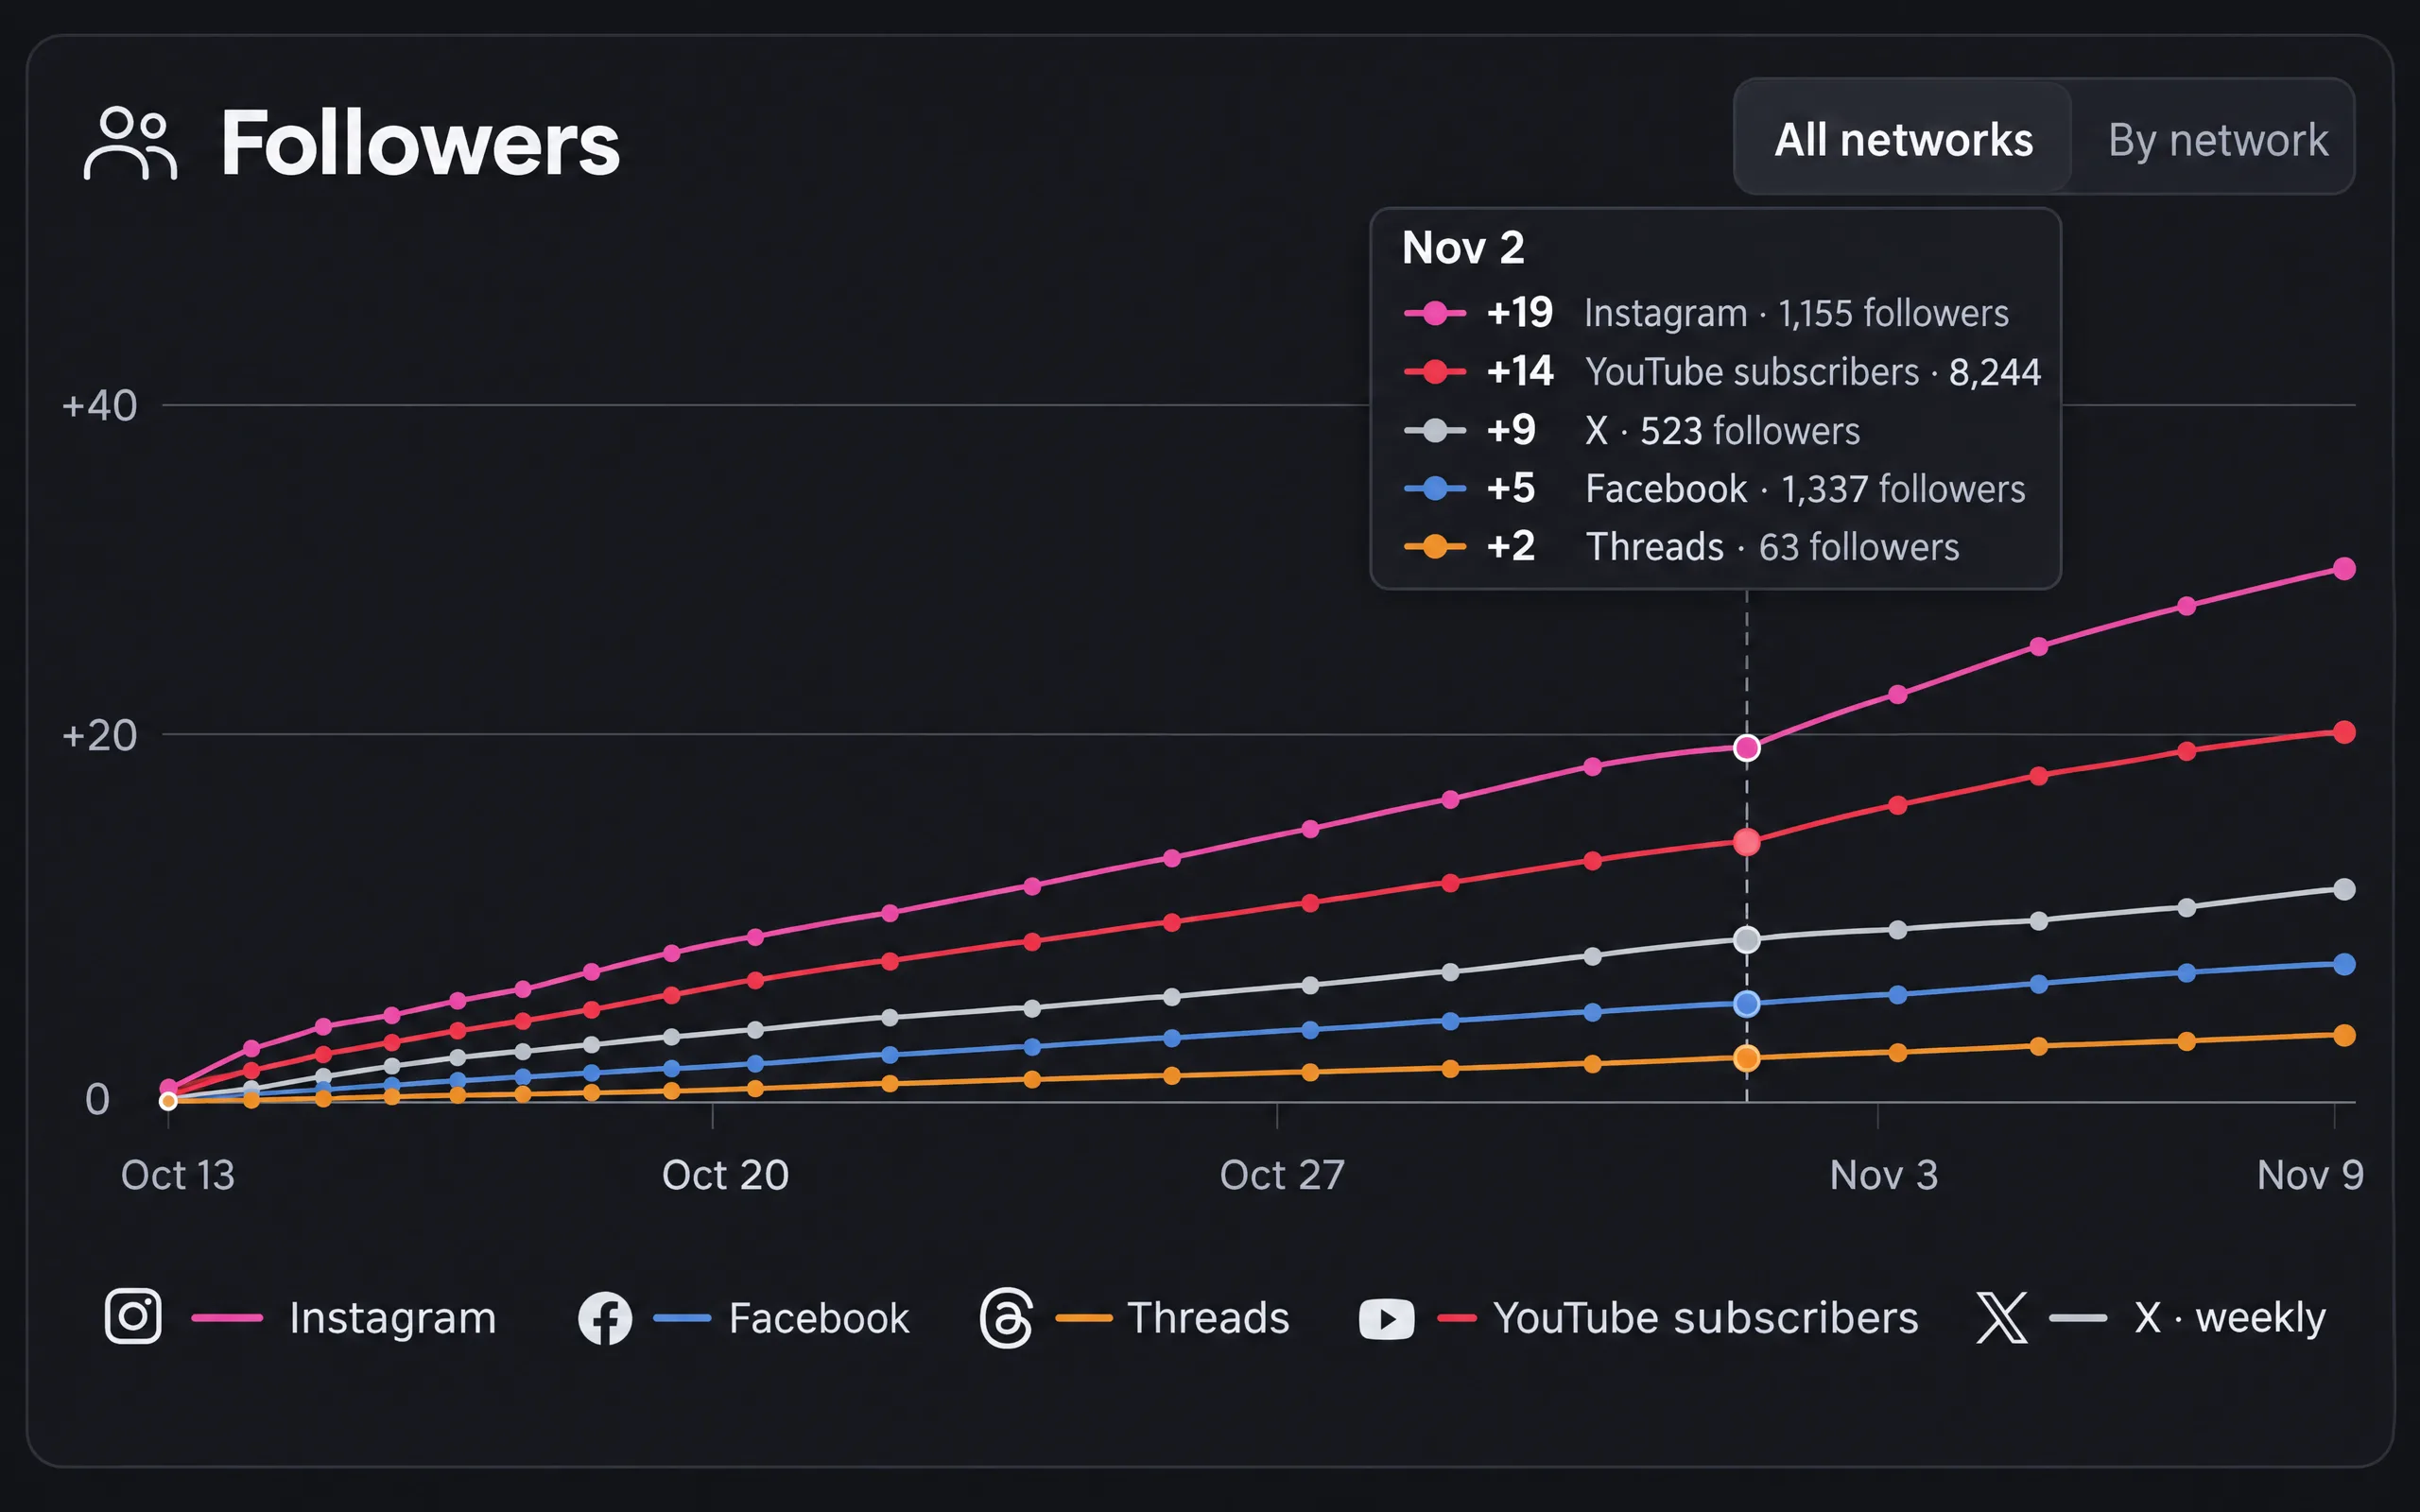
Every network, one chart
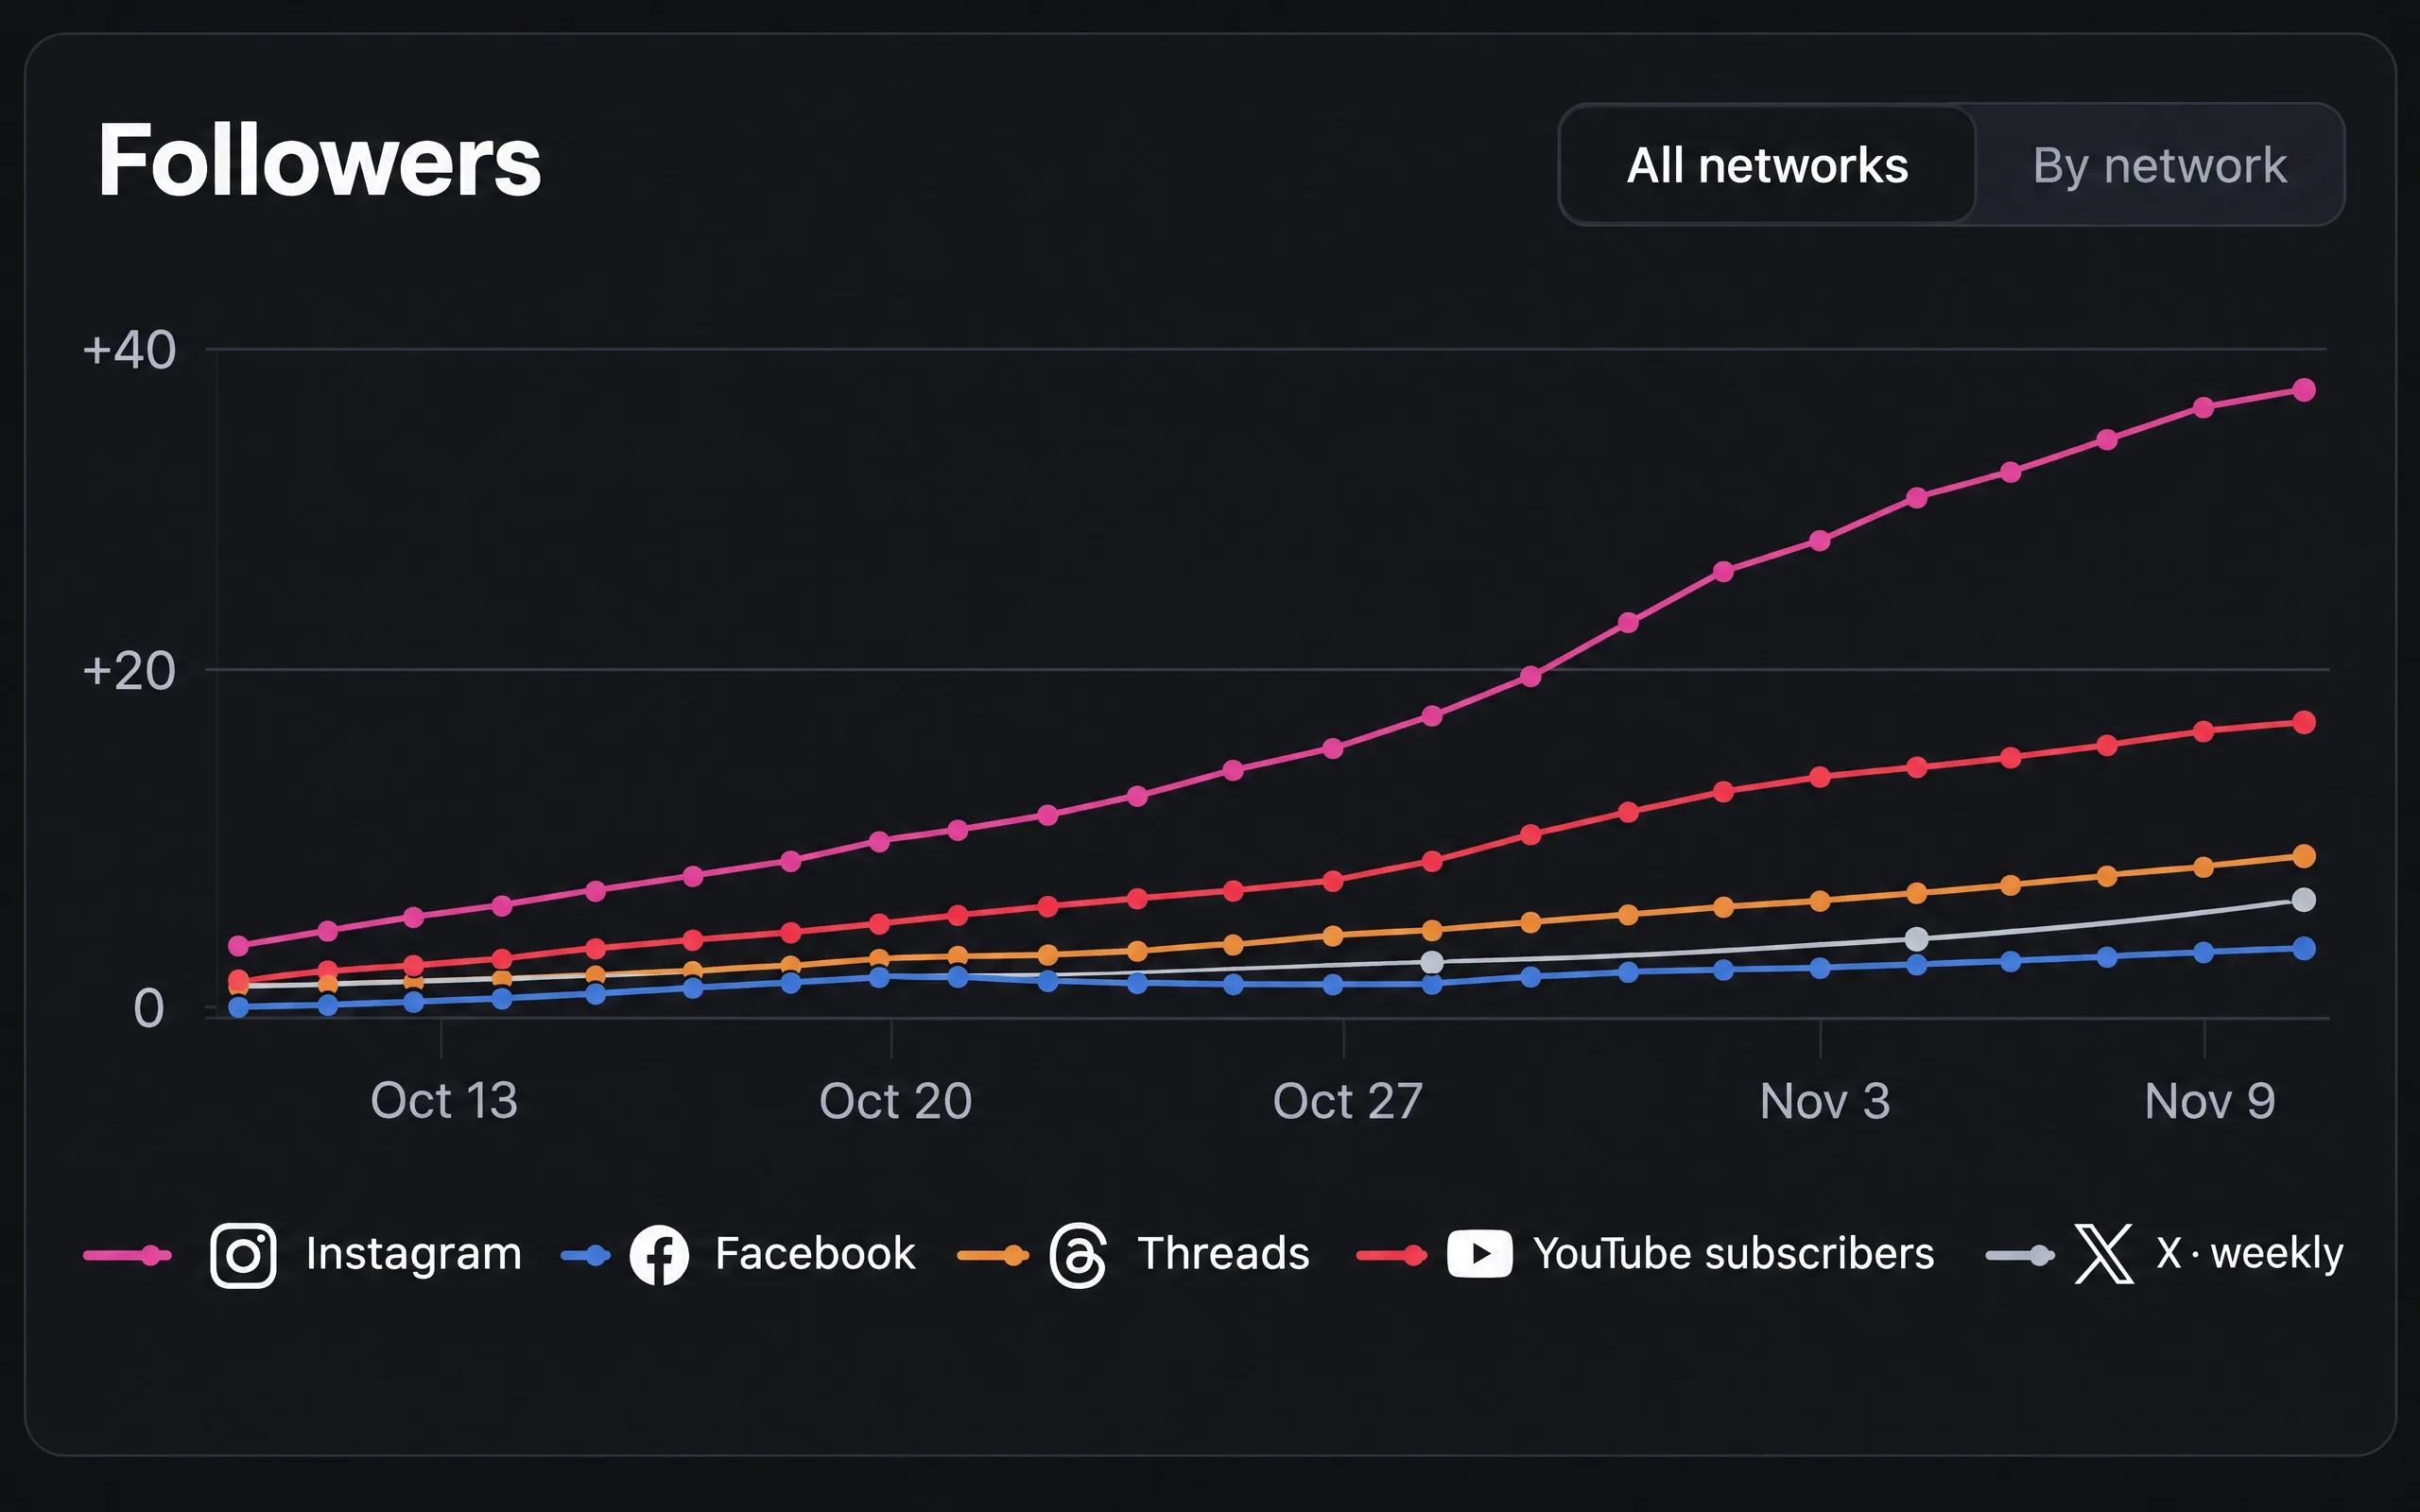
Performance opens on All networks: one line per network, in its own color, with a point for every count. See at a glance which one is growing. Each network still has its own chart.
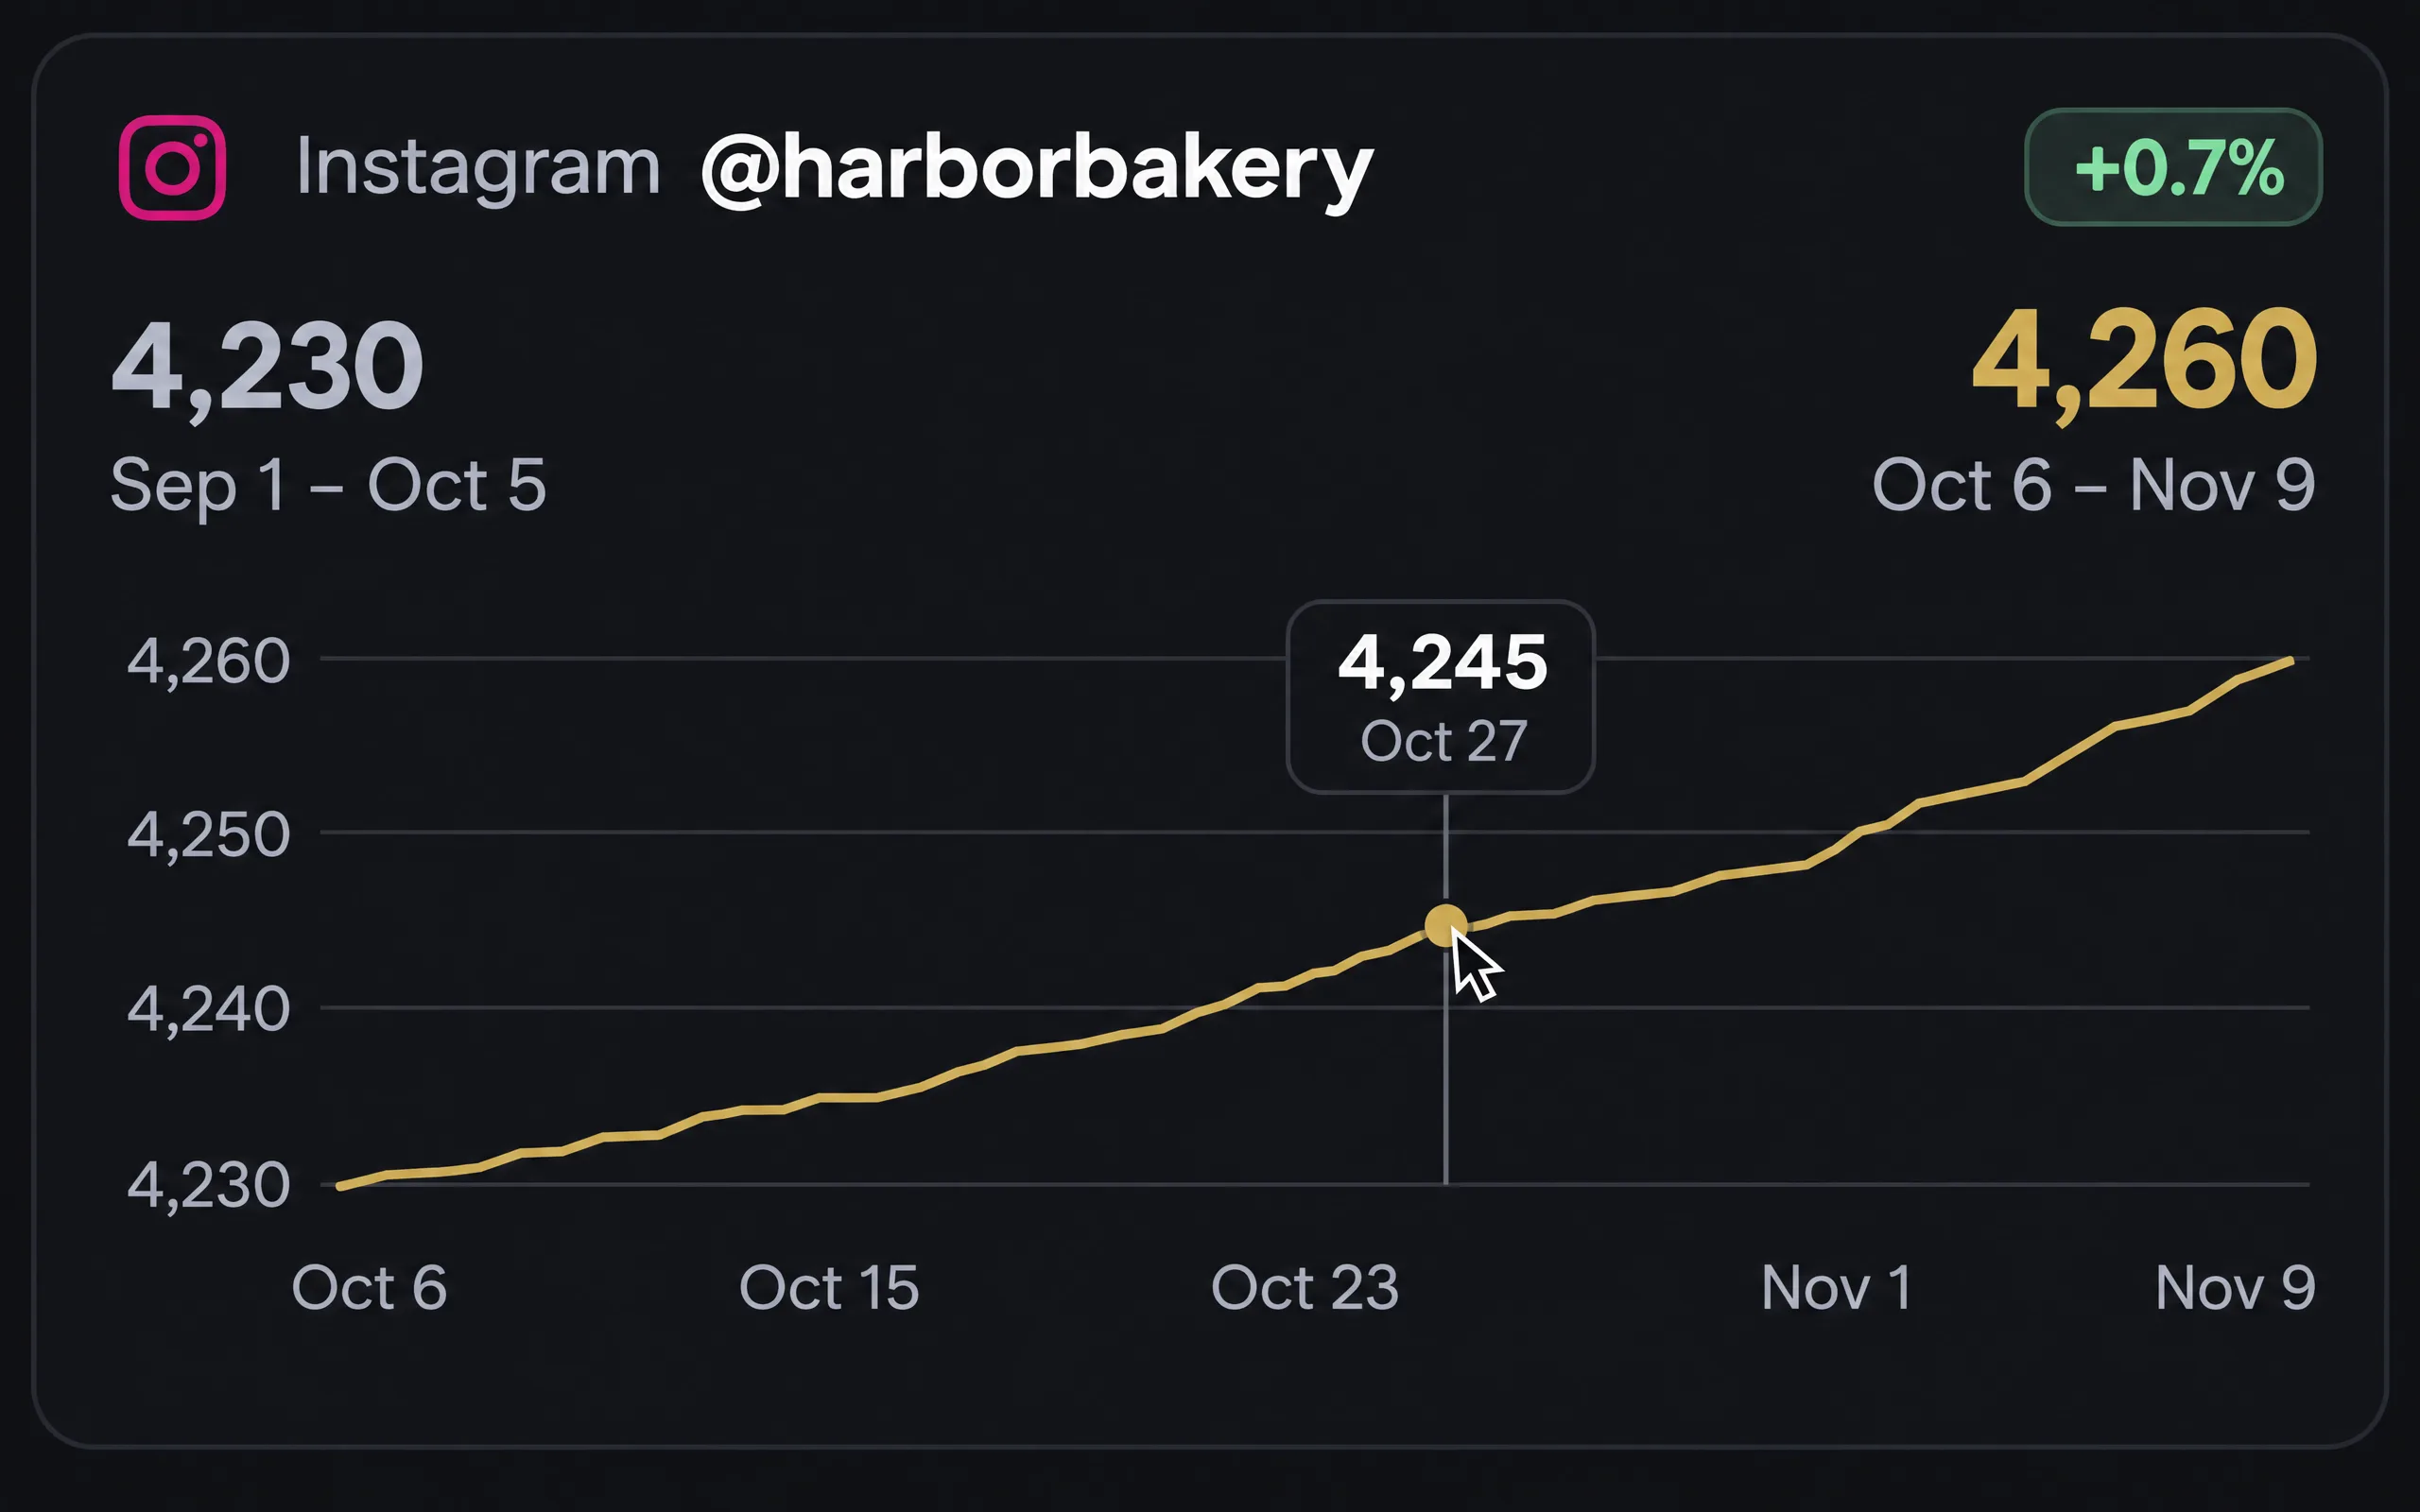
The exact number on every day
Charts now show numbers on the side and dates along the bottom. Move over a point, or tap and drag on your phone, to see that day’s count.
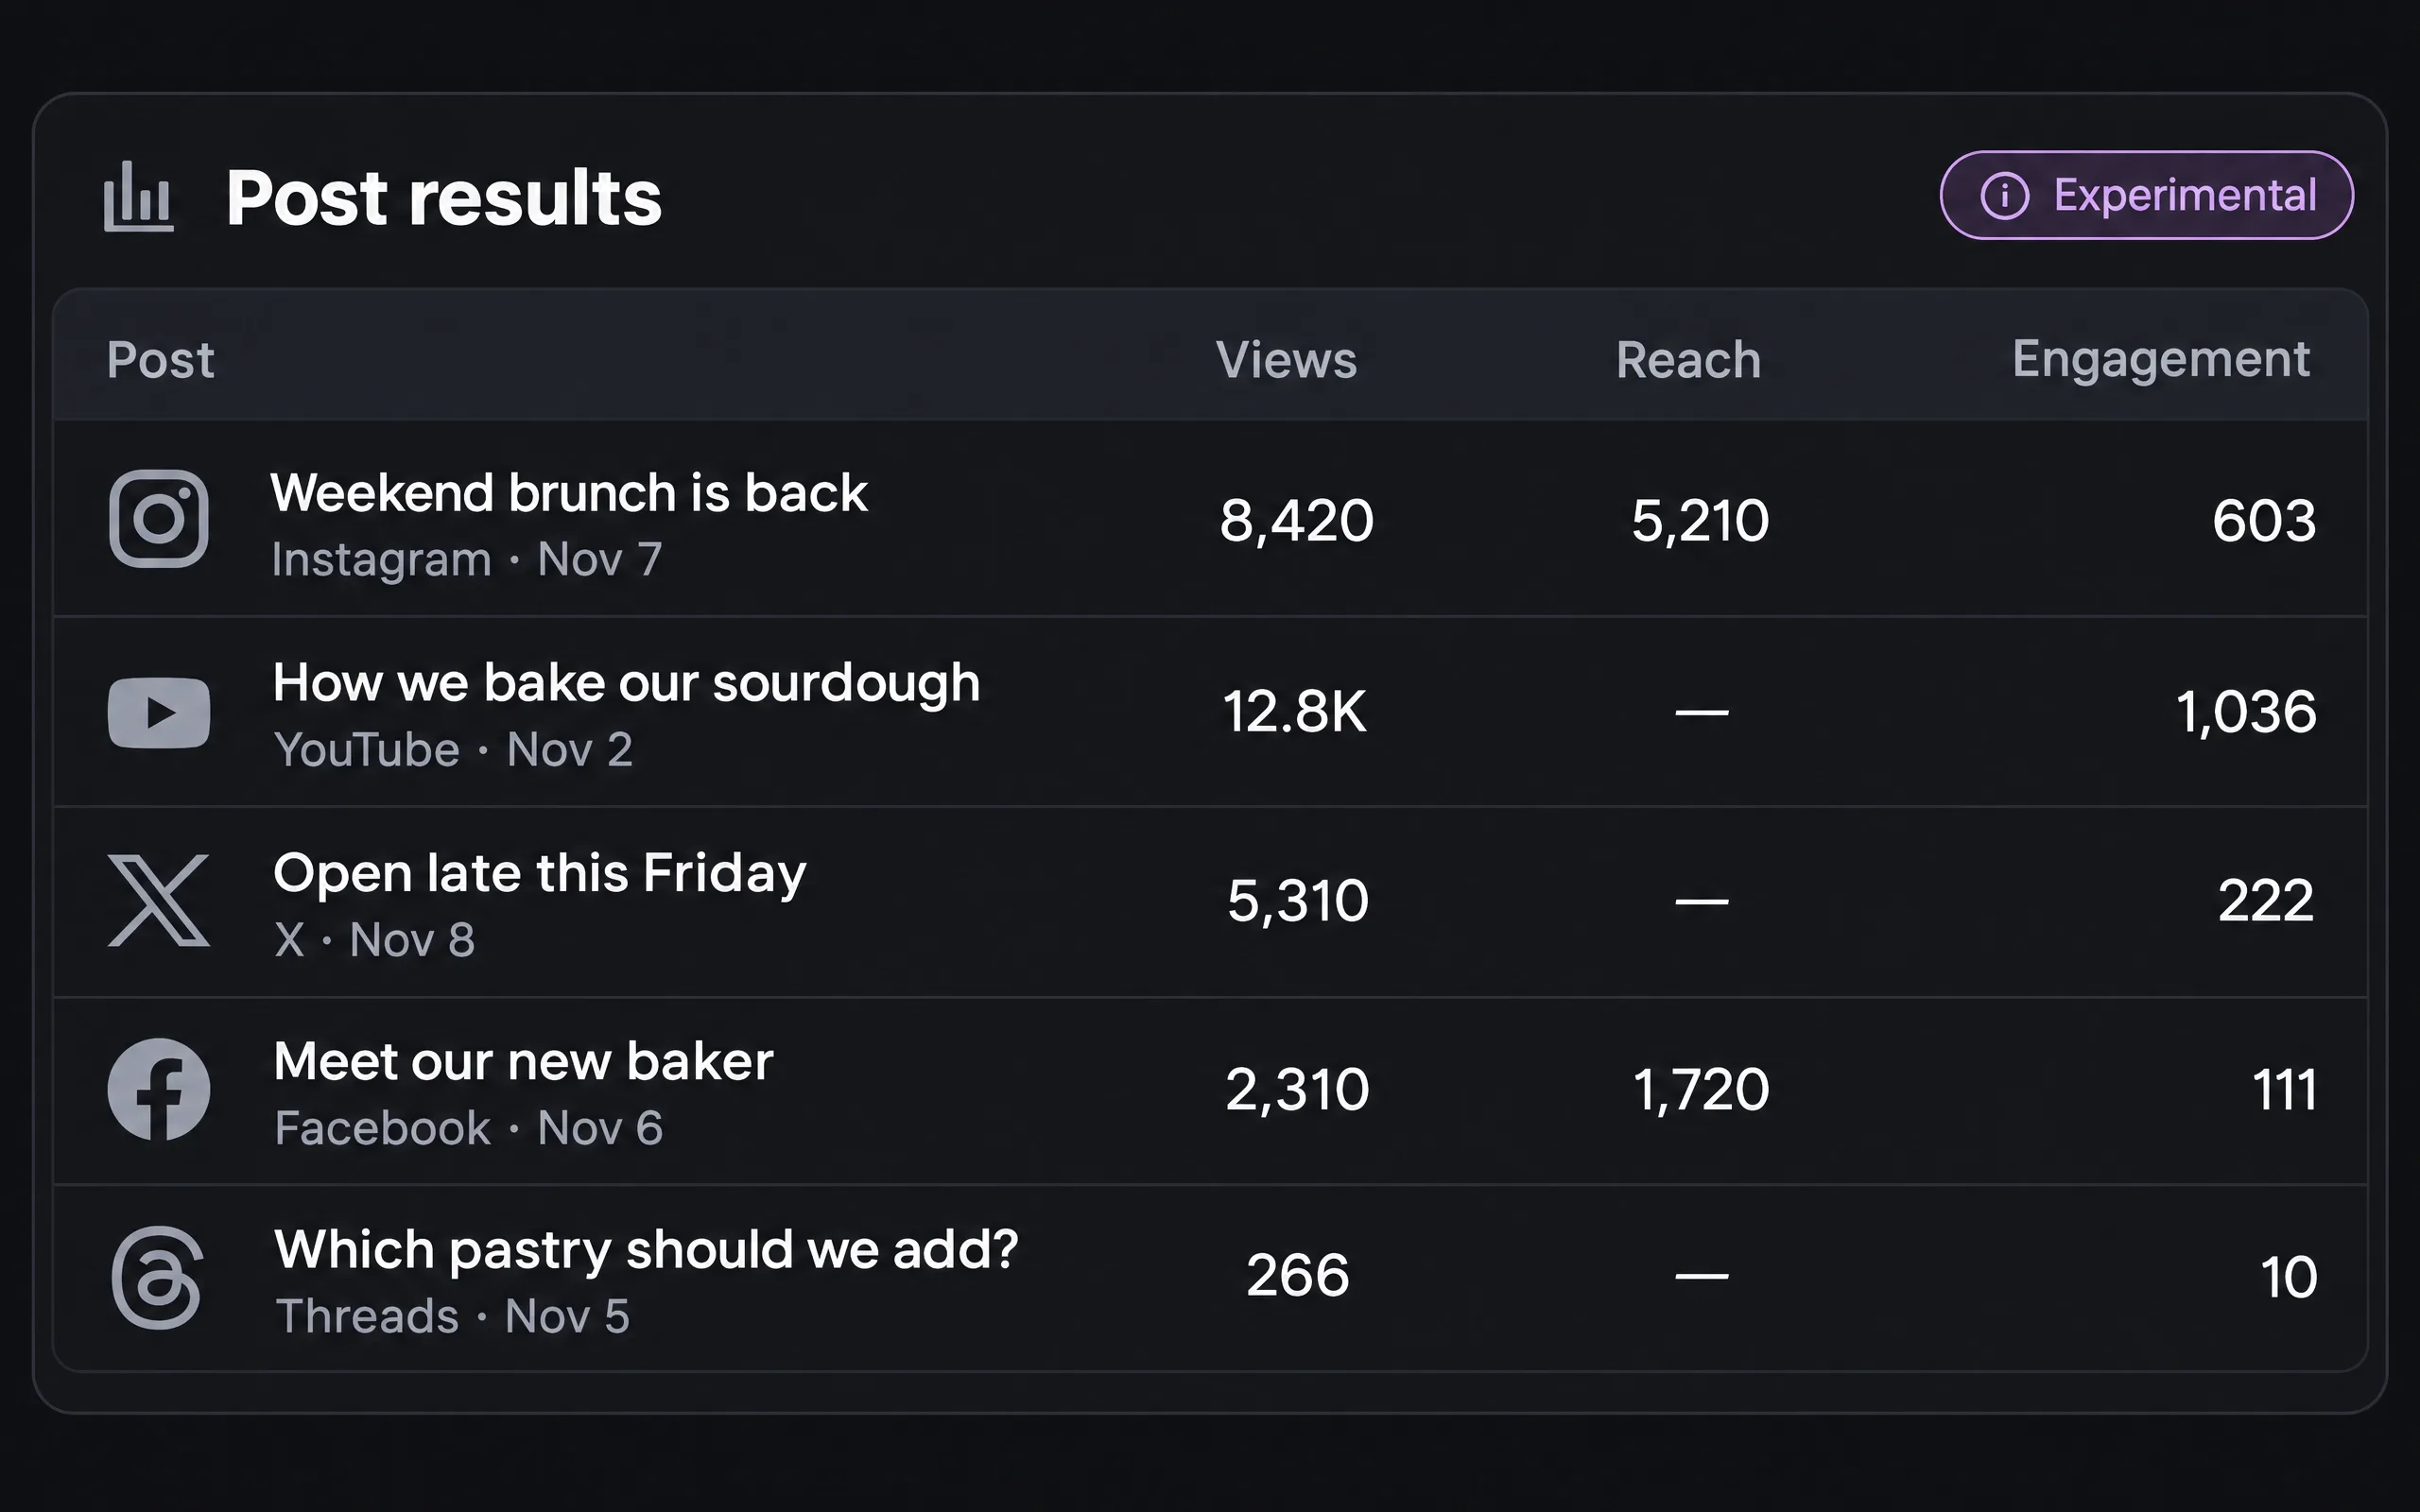
Know where each result comes from
Post results shows the network’s logo before each post, so you know right away where your most viewed post was published.
Your brand’s photo, from its accounts
In Brand settings, Social photo lets you use the picture of any connected account. A brand without a photo takes its Instagram picture, or its Facebook Page’s.
Also improved
- AI assistants shows each connection in one line with a label, Cloud app or Desktop app, so you can tell them apart. Team shows the same labels.
- Changing a brand’s photo keeps Brand settings open, so you can try another one. Save changes finishes.